Dear Reader,
My name is Rick Pendergraft.
Today I’m going to show you something you’ve probably never seen before.
And you may have a hard time believing it’s actually real.
You see, in the next few moments I’m going to reveal to you a very simple, very proven and yet very HIDDEN pattern that can position you to…
- Only buy stocks that are trending UP in value!
All it takes is for you to recognize “the Pattern” that I estimate only around 1% of investors can see.
It looks like this… X
Yes, just a boring old X.
But when you’re able to see it on a stock chart… it becomes a lot less boring.
I’ll show you… take a look at this chart for Intercept Pharmaceuticals (ICPT), a nearly $4 billion New York drug maker.
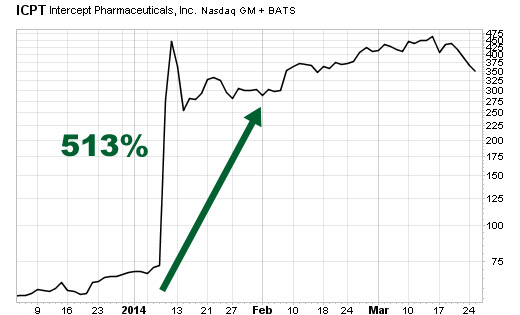
You’ll see that around the end of December 2013, ICPT’s share price began to inch up.
And then a couple weeks later it skyrocketed!
It stayed steady over the first couple of months of 2014, even hitting a new high in the beginning of March.
But then it began to turn downwards at the end of that month.
Now everything I’ve just told you is highly simplified.
Notice I haven’t mentioned anything about why ICPT’s share price took off. Nor have I talked about why it began to drop a couple months later.
Nothing about sales figures, earnings reports, FDA approvals… any of it.
Because NONE of that stuff matters.
Not when you’ve identified the Pattern.
The big flashing X that tells you exactly when to buy and exactly when to sell.
Take a look at the ICPT chart again. And this time you’ll see that the ONLY things that matter are two dates.
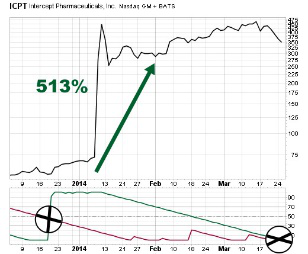
Check out December 18th.
There you’ll see the X that I’m talking about.
The green line shoots WAY up… and the red line is plummeting down.
They intersect, form an X… and now we have our pattern.
And following that first X, ICPT’s stock ends up soaring up 513%!
Then on March 25th, you’ll see that the green line dropped down and crossed over the red line as it began to creep up again.
There’s our second X.
And right after it occurred, ICPT’s stock collapsed like a burning building.
In fact by the end of 2014 the company had lost over 70% of the gains it made over those first 3 months of the year.
BUT – if you had simply bought ICPT shares on December 18th when that first X appeared…
And then sold them on March 25th when the second X showed up…
You would have locked in gains of 513% in just over 3 months.
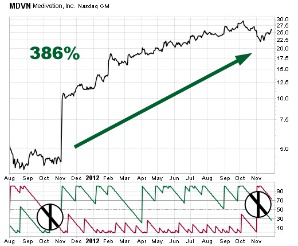
Go back a year earlier and you’ll see the same situation unfold with Addus Homecare Corporation.
Addus supplies home services to the elderly and disabled. Back in 2012 it was trading for under $5 a share.
But as you’ll see on the chart below in September of that year, Addus’ share price exploded.
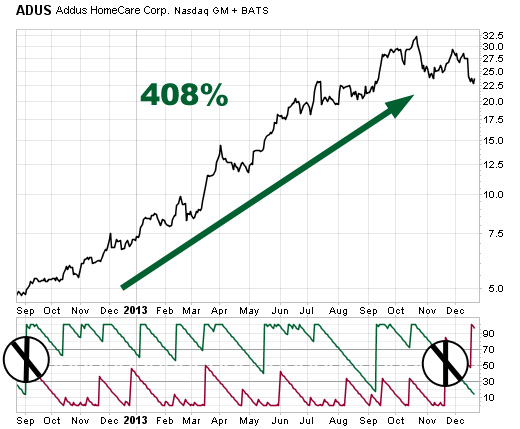
On September 5th, the first X appears with the green line shooting up and the red line dropping down and crossing over.
That began a prolonged price climb for Addus that took place over the course of a year and pushed shares up above $25.
Then on November 19th, 2013, you can see the green like drops down and crosses over the rising red line.
The second X is formed… and the Pattern was complete.
Addus ended up shedding about 45% of its gains in the months following the second X.
But that wouldn’t have mattered to you.
All you needed to do was buy Addus after September 5th 2012 and then sell it when the second X appeared on November 19th, 2013.
If you did, you’d have been able to rack up gains as high as 408% over that year.
And you’d have been out of the trade before their price began to tumble.
So why did Addus’ share price spike so high over that year?
And why did it drop down so much after November 19th?
Who cares!?
IT DOES NOT MATTER.
The only things that matter are the two dates.
The date the first X appears and the date the second X appears.
That’s it.
Here’s a chart from Arrowhead Research (ARWR).
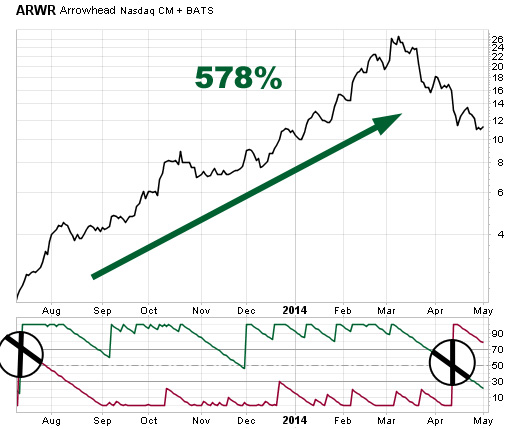
You see the first X? It appears on July 12, 2013.
The green light shoots up, right across the falling red line.
Immediately following that, ARWR lights up like a firecracker!
Their shares were trading that day for around $2.34.
And on April 10th, 2014, the day the second X appeared…
ARWR was trading at $15.87… an incredible 578% gain during the Pattern’s run!
Following that second X, Arrowhead Research’s share price sunk all the way down to the $5 range.
So sure, you could have still made money on the stock if you had held on until then.
But you wouldn’t have pocketed a huge 578%!
All you had to do was buy ARWR when the first X appeared and then sell when the second X arrived.
Do that – and you’re out, scot free, counting your 578% profits while other investors are watching most of theirs go up in flames.
The Pattern is like having an alarm set that tells you exactly when to buy and exactly when to sell a stock at the precise right time.
And its reliability places you in prime position to only add stocks to your portfolio that are trending up at your time of purchase.When you see the X for the first time, you simply buy shares of the company it’s appearing in.
Then when the X appears a second time… sometimes that’s in a few weeks, sometimes it’s a year later… you simply sell those shares and cash out with your profits.
That’s it.
There’s no complicated exotic investment vehicles you have to get a special accreditation to buy.
No options or bonds or overseas exchanges to worry about.
Just basic, run of the mill stocks and two actions to take.
Buy… and sell.
And the Pattern tells you exactly when to do both.
The three examples I’ve just shown you are only a fraction of the opportunities you could have taken advantage of over the last 5 years.
That’s when I first discovered the Pattern for myself.
In fact, ever since I learned about the Pattern and began recognizing the X’s when they appeared…
I’ve been able to pinpoint 2-3 Pattern opportunities every month.
Can you imagine banking 2-3 gains of over 300% every single month?
The Pattern gives you that potential.
When I’ve told friends and colleagues about the Pattern many of them ask me the same question…
“I look at stock charts all the time, but I don’t see the Pattern. How are you able to spot it so easily?”
All I can tell them is “practice makes perfect”.
What I mean by that is this – I’ve been working inside the markets for nearly 20 years now.
I’ve been the co-manager of two mutual funds and had over $200 million in separate accounts under my control during my career.
I’ve taught for the New York Institute of Finance. I’m a retired Lt. Colonel in the Air Force.
And my professional designation is as a Chartered Market Technician… one of the preeminent credentials in all of finance.
I’m telling you all this, not to brag, but because I’ve probably studied more charts over my two-decade career than 99% of the world’s population.
I see things differently… and after I show you exactly what to look for today, you will too.
Because you’ll be able to see the Pattern. Just like I can.
And you’ll also be able to identify the key characteristics of winning companies (which I’ll reveal more about in a moment).
And they’re what will make it even easier for YOU to begin potentially profiting off of these trades…
Given these numbers, it’s not a stretch to say that the Pattern is the most lucrative trading tool I’ve discovered in my career.
And with 2-3 of these Pattern opportunities presenting themselves every month, you may never have to worry about researching a stock again.
Because once the Pattern begins, the stock always trends upwards. Yes… if you act in a timely fashion –
You’re able to ONLY buying stocks trending UP!
How does the Pattern make this possible?
Well look at this chart I showed you earlier for Addus Homecare…
See what happens as soon at that first X appears and the Pattern begins?
Addus’ stock begins to rise… usually within a 48 hour time period.
And it continues to rise. Over the course of more than a year!
Until the Pattern completes itself with the appearance of the second X.
That’s when the stock begins to dip back down. Not like it did a few weeks before. (You’ll notice Addus went back up after a short drop.)
This time it went for a prolonged plunge. One that wiped out nearly half of its gains..
All you need to do is lock in on this span of time.
You BUY when the first X appears. You SELL when the second X appears.
If you did this on every single one of these trades, you’d have made money on ALL of them.
Through my extensive research of the Pattern I’ve seen gains of…
820%
578%
562%
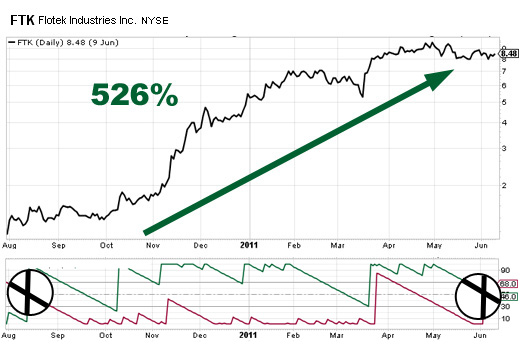
526%
513%
439%
408%
406%
386%
295%
288%
216%
213%
210%
194%
181%
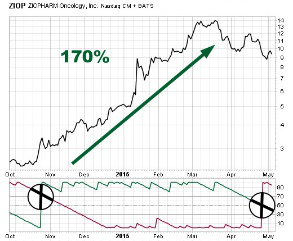
170%
And many many more…
And if you buy in a timely fashion after the first X appears and before the second X appears, you could end up only buying stocks that are trending upwards.
Every single time.
That’s the power of “the Pattern”.
But I know it’s not enough to just tell you that the Pattern exists.
That’s why I want to show you exactly how it works.
What’s behind it, why it works and why it’s a shockingly simple way of collecting gains time after time.
So let me break down for you what’s fueling this incredible profit tool…
Pretend you’re standing about 20 feet away from a giant brick wall
In your hand you’ve got a brand new baseball.
You wind up your arm, cock back and throw that ball with all your might at the wall.
Now if you’re a professional baseball player, that ball could travel at speeds upwards of 100 mph.
And even if you’re not, it’s still going to travel at a reasonably high speed.
The moment that ball leaves your hand it’s entered a “high velocity” state.
The momentum of you winding back and pushing all your force behind your arm, into throwing that baseball means it’s able to overcome all the natural forces that would try to stop it, including gravity!

But then the moment the ball hits that brick wall 20 feet ahead of you, all that momentum comes to a halt.
With the momentum stopped, gravity takes over and the ball drops to the ground instantly.
Do you see where I’m going with this?
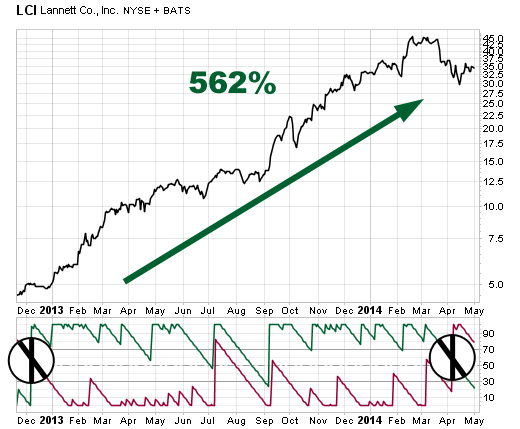
Take a look at this chart for Lannett Company Inc. (LCI) which develops, manufactures and distributes generic versions of pharmaceuticals in the U.S.

Check out December 7th 2012… you’ll see the Pattern emerge for LCI when the X is formed.
The stock was trading for less than $5 that day.
Now think of December 7th as the moment you’re standing in front of that brick wall with the baseball in your hand.
And as soon as that first X appears, you wind up and throw that ball straight at the brick wall as hard as you can.
That’s exactly like what happened with LCI’s stock when the Pattern was kicked off by that first X.
It’s like it was shot out of a cannon… or the hand of a flame throwing pitcher for the New York Yankees.
Nothing could stop it. The momentum of the stock sliced through anything and everything that would try to take it down.
And for more than TWO YEARS, that momentum continued. All the way up until April 4th, 2014 when the second X finally appeared and the Pattern was complete.
Think of that as the moment the baseball hits the brick wall and comes plummeting back down to Earth.
Because that’s exactly what happened to LCI’s stock when that red line crossed back over the green line and formed the second X.
“Gravity” took over and the momentum ground to a halt.
Now it doesn’t matter what “gravity” actually is. Whether it’s poor earnings, a failed FDA test or company mismanagement.
The only thing that matters is that on April 4th, 2014, LCI’s stock was trading at almost $33 a share.
That’s a 562% gain!
And the Pattern told you to sell at the precise time to the momentum ended.
Now LCI’s stock took off again a few weeks later. And sure you could have bought back in again if you wanted…
But by simply putting this trade on cruise control and riding out the momentum ride out over the course of two years you could have easily turned:
$1,000 into $6,662…
$5,000 into $33,100…
$10,000 into $66,200…
$20,000 into $132,400…
Just by buying in at the first X and selling at the second X.
It’s like having an alarm clock that only goes off exactly when you should buy and when you should sell!
The same goes for Espirion Therapeutics (ESPR)…
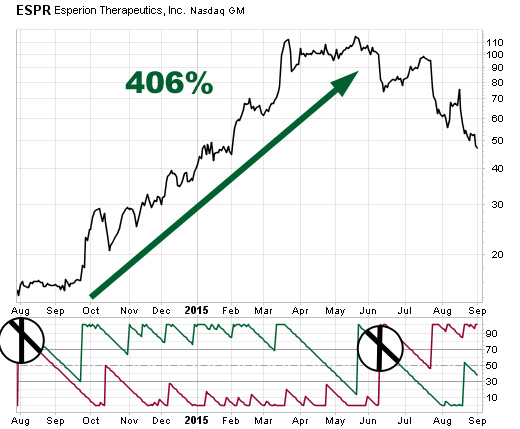
On August 4th, 2014, ESPR was trading at $16.14.
Then the Pattern began with the red line (gravity) heading down and the green line (momentum) heading up, crossing over each other.
ESPR’s stock was barreling ahead like a freight train.
And its momentum carried it up and up and up… all the way until June 10th, 2015 when gravity caught up with it and the red line shot up over the green.
On that day you could have sold ESPR for $81.68 a share… a 406% profit!
Could you have sold when it was slightly higher?
Yes it’s true you could have… but you would have had to monitor ESPR for months. Watching their headlines, looking for analyst opinions, racking your brain and making yourself miserable trying to figure out when the other shoe was going to drop.
OR… you simply could have waited for the Pattern to complete itself and give you a concrete moment when momentum on the stock had ended.
And you would have walked away with over 400% on your investment… with hardly any work, any worry and any second guessing.
Because as you’ll see ESPR dipped all the way down into the $50 range just a couple months later.
Who cares why? It doesn’t matter one bit what the “gravity” is that took its price down.
I really could go on and on here.
There’s hundreds of examples over the last two decades where the Pattern has alerted investors exactly when to buy into a stock before its momentum takes off and exactly when to sell when it comes to a halt.
That’s why today I’m announcing that in partnership with TradingTips, one of the nation’s leading financial publishing firms, I’m going to be managing TradingTips first ever trading research service entirely devoted to…
- Spotting the Pattern in multiple stocks each month.
- Alerting our readers to the opportunity created.
- Monitoring those stocks for as long as momentum continues.
- And finally alerting our readers when the Pattern is complete and that it’s time to sell.
The idea behind it all is that I want to make it as easy and automatic as possible for you to profit from these Pattern opportunities.
That means I’ll pinpoint them for you when the first X appears.
I’ll alert you to buy. Then I’ll keep track of the stock until the second X appears.
Then I’ll alert you to sell.
Now I won’t try to fool you into believing you’ll profit on every single trade you make –
that’s an ability even Warren Buffett or George Soros don’t possess.
But The Pattern positions you for gains better than almost any other indicator I’ve come across in the market today… so the goal here is win far more than we lose.
I’ve literally taken all of the work, except for executing the trade itself, off of your plate and put it onto mine.
There’s no other way you could do less to make more.
We’re calling this brand new service…
The PPK System
Here’s what that stands for:
P = Pattern
P = Price
K = Key Pivots
While I’ve already explained to you how the Pattern works, it’s important to know what’s behind it.
The Pattern is based on a mathematical formula that looks like this:
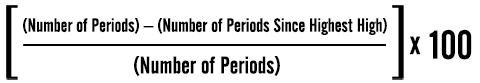
But unlike others who may want you to understand all the X’s and O’s behind it, I don’t want you to concern yourself with this formula much at all.
Because there’s really no reason to!
Not when The PPK System will alert you whenever it sees a Pattern opportunity you should be buying into.
For instance – back on November 28th 2014, Advaxis Inc. (ADXS) saw it’s X form when its momentum shot up and broke through its “gravity”
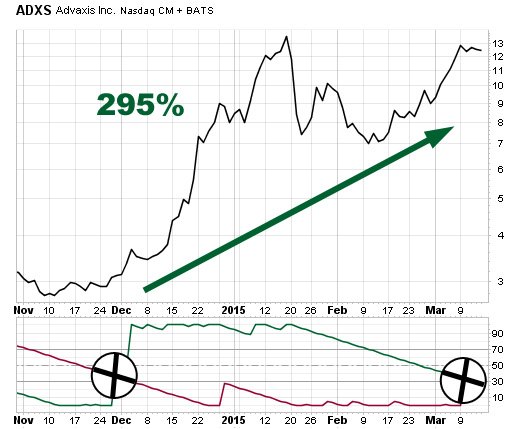
ADXS was trading for $3.12 that day when the Pattern began.
102 days later, on March 10th, 2015, momentum dropped below the stock’s gravity and the Pattern ended.
But not before ADXS shot up to $12.33… a 295% gain!
Now obviously The PPK System wasn’t in existence at the time of this trade. But imagine if it was…
Sure, you could have sat at your computer, applied the formula, crunched the numbers and tried to pinpoint when the Pattern would emerge for Advaxis and when it would end.
And you could monitor the stock throughout the entire Pattern (which as you’ve seen can last for years!) to be sure that you sold when the second X appeared.
OR … you could have sat back and waited for my alert to hit your inbox on November 28th and simply bought the stock.
Likewise on March 10th when my sell alert would have gone out to you.
You wouldn’t have had to spend more than a few minutes each day checking your email for my alert.
Otherwise you wouldn’t have had to give this trade another ounce of effort or worry… and simply collected a 295% return on your money when it was all said and done.
Because The PPK System would have taken care of all the heavy lifting (including that mathematical formula) for you!
Again, The PPK System wasn’t around to issue this recommendation… but is today and that means going forward you have the opportunity to utilize it for profit off of these Pattern situations.
And no PPK is not some sort of high-tech super computer that’s crunching data all day and spitting out trades without any idea or feeling for whether it’s a good buy or not.
I’m actually running the system personally. And I’m applying several levels of due diligence to it as well.
This is by no means a trading service on “auto pilot”.
I’ll be making sure that the Pattern is real and that it’s sustained. Enough to produce a meaningful profit at least.
And I’ll also be ensuring that the stocks The PPK System identifies the Pattern on, are affordable.
Because if you’ve got to spend over $1,000 to accumulate 10 measly shares of a company, what’s the point?
That’s the second P of The PPK System – Price.
And here’s how I’ll ensure you’re only buying stocks that are good AND cheap…
How to spend LESS… and make MORE
This may sound a bit silly… but I actually employ a “magic formula” to ensure that the stocks we use in The PPK System will cost you very little.
Therefore maximizing your potential gain!
Because when you combine the Pattern AND the “magic formula” you’re able to:
- Only buy stocks that are trending upwards, and…
- Only buy stocks that are priced low enough that your return relative to your investment is sky high!
So what is the magic formula?
It was developed by a man named Joel Greenblatt, the founder of the ultra-successful hedge fund, Gotham Capital.
From the time he founded Gotham in 1985 all the way until 2006, Greenblatt’s fund produced a staggering 40% annualized return to its investors.
He made a lot of folks, VERY rich.
And he did so using this magic formula that I now apply to The PPK System.
I won’t bore you with the finer details but what this formula allows you to do is find the best cheap stocks with the highest yields and the highest returns on your capital.
The formula looks only for a certain kind of stocks. It…
- Establishes a minimum market capitalization (usually greater than $50 million).
- Excludes utility and financial stocks.
- Excludes foreign companies.
- Determines a company’s earnings yield = EBIT / enterprise value.
- Determines company’s return on capital = EBIT / (net fixed assets + working capital).
- And ranks all these companies above chosen market capitalization by the highest earnings yield and highest return on capital.
In 2003 Greenblatt hired a “computer jockey” and spent $35 million running a back test on what would have happened if investors had only bought these types of stocks.
The results showed an annual return over those 17 years of over 30% and the formula proved to beat the S&P 96% of the time!
A 30% return on your money every year? Risking LESS of your money than you’d have to normally?
It’s the ultimate win-win for an investor.
That’s why, when I run The PPK System on the stocks that are showing the Pattern, I then narrow down my list even further with the help of Greenblatt’s magic formula.
And the end result means you’re still getting the same guaranteed upside of the Pattern… but with cheaper companies and better potential profits!
Why isn’t everyone doing this???
Throughout my years in the financial industry I’ve met countless professional traders.
And one characteristic they all in common is that they’re stubborn.
They all believe that the way they go about choosing their investments is the RIGHT way.
That’s probably why so many of them don’t use the “magic formula… or don’t go after stocks that are experiencing the Pattern.
I prefer to stay nimble and adjust my approach based on what I see is working..
And these two strategies, combined, succeed better than I’ve seen any other approach in quite a long time.
By the way, you’re probably wondering what the “K” stands for.
Well once I identify the Pattern having begun on a stock (that first X) and then run it through the magic formula test… I can then decide whether or not it’s a good buy.
And if it is, I’ll enter the play at the Key Pivot Point.
This point is usually within 24-48 hours after that first X appears and the Pattern begins.
It’s crucial to get in at this Key Pivot Point because it ensures you’re in for the whole ride as the stock’s momentum carries it higher and higher over the course of the Pattern.
For instance, if you’d bought Eagle Pharmaceuticals on November 10th 2014 when its first X appeared and the Pattern began, you’d have entered in at the Key Pivot Point of $13.50 a share for the stock, as you can see below…
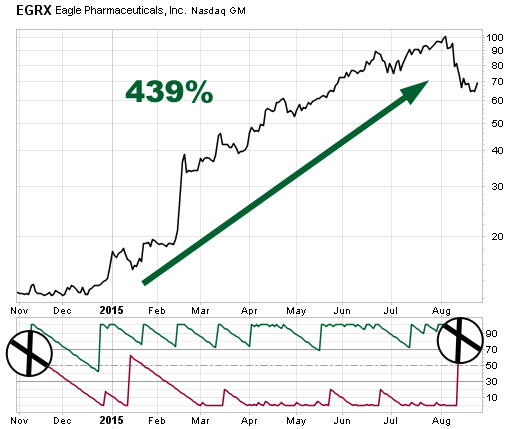
Eagle passed the “magic formula” test and was a cheap buy with high earnings potential.
How high? Well, when the Pattern completed and the second X appeared with momentum being overtaken by gravity, Eagle’s share price was at $72.75!
That’s a 439% gain!
If an investor waited even just a few weeks, they’d be buying into Eagle at over $20 a share… severely limiting potential profits.
So you can see why the Key Pivot Point is so important to hit.
Let’s recap The PPK System…
P = Pattern (identifying when a stock’s momentum overtakes its gravity and produces that first X)
P = Price (only buying good and cheap stocks based on Greenblatt’s “magic formula”)
K = Key Pivot (buying in within 24-48 hours of the Pattern beginning to ensure top profits)
The power of all three of these factors coming together in your favor could mean…
Multiple triple digit winners month after month after month…
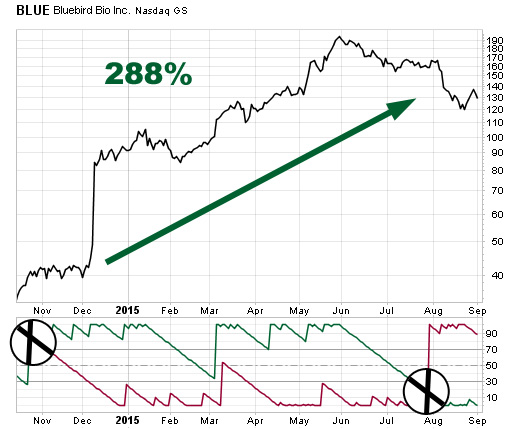
If you look back over many of the opportunities The Pattern has presented over the past couple of years, the results are truly astounding.Like the 288% investors made on Bluebird Bio Inc.
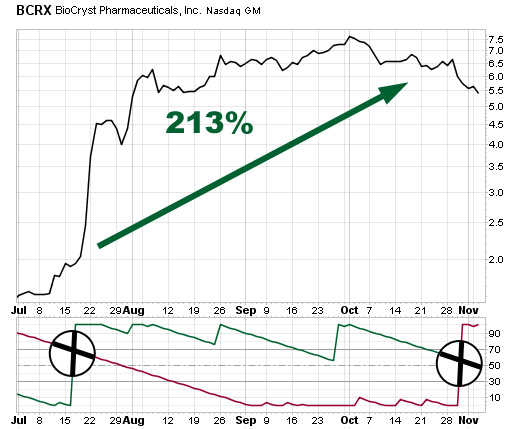
The 213% profit traders banked on BioCryst Pharmaceuticals…
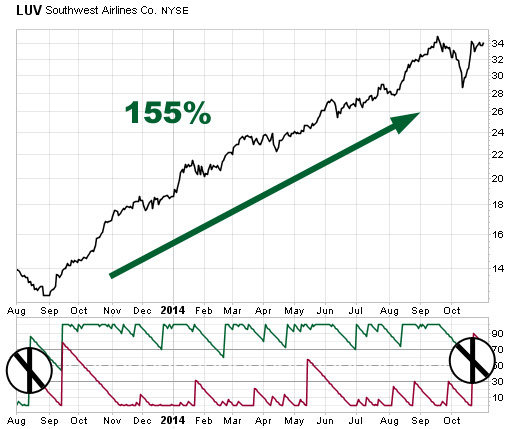
The 155% gain Southwest Airlines returned…
Or the amazing 820% increase Cal-Marine Foods saw!

Now I’m sure you know, given the roller coaster ride we’ve seen the stock market go through over the last year, that nothing is certain when it comes to investing.
And you should never gamble with your future and invest more than you can afford.
So I won’t tell you that that combining these three factors from The PPK System will guarantee winners 100% of the time.
But I will say that given the windfall profits I’ve seen when these factors have been applied to a trade – I’m entirely confident that The Pattern is as good an indicator of profits as there is in the market today.
And that no matter what the market is doing… whether it’s bull, bear or completely flat – I’ve seen the Pattern produce potentially profitable trades, 2-3 times a month, every month.
I’ll locate them, quality check them and then alert you to them. Guiding you every step of the way throughout the process.
That’s what I designed The PPK System to do after all.
And my goal is to deliver you a steady stream of winning trades, double, triples or perhaps even higher!
Just imagine if you had been able to identify and profit from The Pattern long before now. Think of the profits you could have made…
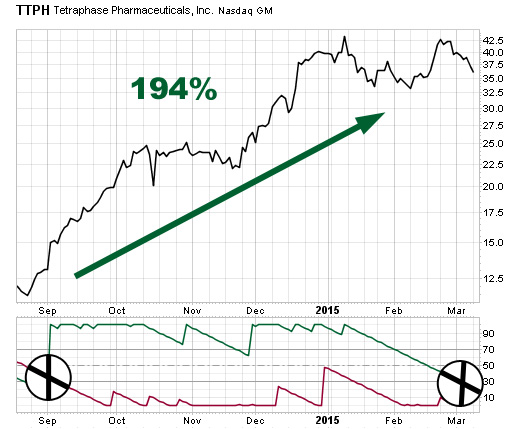
Like the 194% gain on Tetraphase Pharmaceuticals.ceuticals.
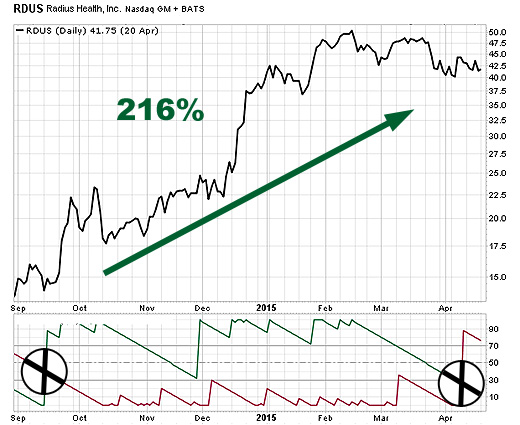
The 216% in profits you could have taken from Radius Health.
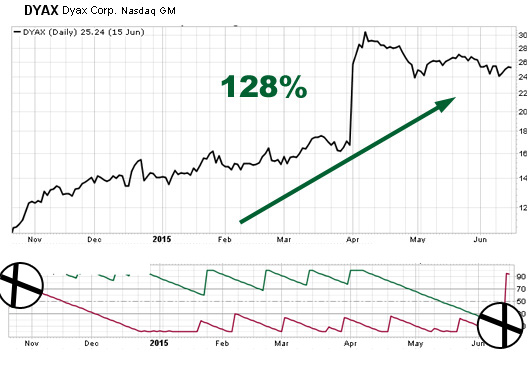
The 128% gain you’d have pulled in from Dyax Corporation.
Or even the 526% windfall you could have made off of Flotek Industries.
I designed The PPK System to identify trades with the potential to generate returns just like these. And now through my brand new research service, I want to share them with you.
The potential profits are sky high… just wait for the second X to appear and cash in!
And remember, since The PPK System only triggers an opportunity to buy after the Pattern has begun – you’ll be in position to only add stocks to your portfolio that are trending upwards.
How high up will they go? We don’t know until that second X arrives and you collect your profits.
But as you’ve seen – the potential for high triple digit gains is most certainly there!
That’s the power of buying cheap, good stocks at the key point of the Pattern.
And that’s precisely what The PPK System is designed to show you how to do.
That’s why today, I’m officially launching The PPK System to the public.
Which means you can now become one of the first ever, charter members of this bold new, profit advisory.
Now I understand you’ve most likely been offered services like this before.
And that you may have spent a boatload of money on them as well.
Only to see your results fall FAR short of what you’d even need to make up the subscription cost!
That’s why I think you’ll be very pleasantly surprised by The PPK System.
Because I don’t just apply the “magic formula” of good AND cheap to the stocks I recommend…
I’ll tell you exactly what I mean by that in a moment. But first I want to show you everything you’ll receive as a charter member of my new service.
This is the only time you’ll see this offer…
Let me be 100% straight forward with you here.
This is most likely the only time you’ll ever see this charter membership offer for The PPK System.
What you’ll be eligible to receive today will be far greater than what someone who subscribes in a few months will get.
So what exactly will you receive?
Every month I’ll email you your issue of The PPK System.
No worries about it getting held up or lost in the mail, this issue will be delivered instantaneously straight to your inbox.
That issue will contain 2-3 new Pattern opportunities that I’ve identified and that have passed the “magic formula test of being good AND cheap.
They’ll also be within a reasonable timeframe of that Key Pivot Point that’s so important – meaning their first X will have appeared shortly before.
These buy alerts I’ll be issuing every month are simple and to the point. I take all the guess work out of the process for you.
For instance, say I was alerting you to purchase shares of Ambarella Inc. (AMBA) in your latest issue.
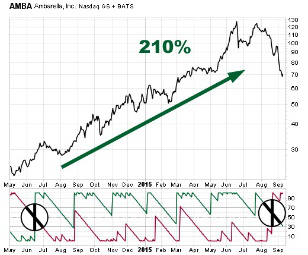
You can see AMBA’s momentum jumped around mid-June when the stock was trading for roughly $28 a share.
Within a short window of time from that first X appearing, you’d receive and read in your issue the following:
ACTION TO TAKE: Purchase shares of Ambarella (Nasdaq: AMBA) at $28 or less.
Pretty simple right? You could call up your broker and read that over the phone to him or her verbatim and you’d have your shares within minutes.
Or simply go online to execute the trade yourself. All the info you’d need is right there in that short sentence.
I’ll also include the chart for every trade, just like the one you see above, in each issue.
That way you can see exactly how and when the Pattern began for yourself!
And when AMBA’s Pattern ended with the appearance of the second X, I’d have included an alert in your issue that said:
ACTION TO TAKE: Sell your shares of Ambarella (Nasdaq: AMBA) at $89.
You would have had the opportunity to collect gains of 210% on AMBA when that trade closed out and their shares had skyrocketed up to $89 thanks to its unstoppable momentum.
Not bad for only a few minutes work right?
In each issue of The PPK System I’ll also update you on active positions inside The PPK System’s model portfolio, letting you know whether or not the Pattern is still ongoing or closing out, in which case I’ll instruct you to sell for close to maximum gains.
You’ll also receive:
Complete access to The PPK System model portfolio with all active positions…
Complete access to our members-only website containing all past issues and trade alerts…
And for charter members only – you’ll receive…
Three more opportunities for you to seize the momentum and profit right now!
Included in your charter membership to The PPK System are THREE bonus reports that I’ve personally put together for you. They are:
BONUS REPORT #1: How to Identify When a Stock Is Starting to Trend
Famed early 20th century investor Jesse Livermore credited much of his success in the markets to “sitting tight” when he found a great investment.
Markets have always given the largest gains to those who can spot trends and then ride them as long as possible. Even in the 21st century, this is still a difficult task because we all get nervous and are likely to close a trade too soon.
What most traders is need is a highly reliable indicator that tells them when a trend is starting and then signals when that trend is over.
Many traders realize they need a tool like this and that explains the popularity of moving averages, the MACD and dozens of indicators. The problem is that the most popular indicators don’t work very well.
In this special report, we reveal the details of an indicator that DOES work but isn’t widely followed.
The fact that it’s not widely followed could very well be the reason it works so well. We’ll share with you how you can you can use this little-known indicator to “both be right and sit tight.”
BONUS REPORT #2: 5 Chart Patterns That Consistently Make Money for Investors
Price charts are included in Wall Street research reports and are available on many web sites.
Although charts are easy to find, it’s not easy to find an explanation of how to use them.
Books on charting often describe dozens of patterns but almost always leave out details about whether or not the patterns work.
This report takes the opposite approach – we detail just five patterns that have been shown to consistently make money for investors. To do this, we update the work of technical analysts with newer research from economists studying behavioral finance.
We found that there isn’t any value in most chart patterns but there are few that work. After reading this special report you will know exactly what to look for in a chart and even more importantly, how to profit from a chart.
BONUS REPORT #3: 7 Cheap and Good Stocks to Buy Right Now

Cheap and good are usually two competing qualities of a stock. It can be incredibly hard to find a company that offers you both.
Cheap means a stock is trading at a discount based on valuation models. The problem for investors is that many cheap stocks deserve cheap valuations because they aren’t good stocks.
A good stock is one which is likely to be profitable in the future. By filtering for good stocks, we avoid disasters like Enron and others that became even cheaper because the companies went bankrupt.
In this special report we share the reasons these seven stocks in particular are both cheap AND good right now.
These three exclusive bonus reports are available ONLY to charter members of The PPK System.
Just in report #3 alone you’ll receive seven additional opportunities to profit… which makes the value of this bonus practically incalculable.
And remember, you’ll only receive these three bonuses if you accept this offer you’re seeing today.
They’re on top of the 2-3 Pattern opportunities I’ll be sending you each month.
Now before I tell you how much a charter membership to The PPK System will cost, I just want to be sure that my new service is right for you.
If it is… if you’re ready to begin using the Pattern to lock down a potential 2-3 triple digit winners every month, no matter which way the market is heading…
…you should be able to answer YES to all three of these qualifications.
PPK System Qualification #1: Are you disciplined enough to manage your portfolio in just 3 steps? No more, no less…
If you’re a “cowboy” or a “loose cannon” who likes to march to your own beat and take risks – this service might not be right for you.
Because in order for The PPK System to be truly effective, you’ve got to be able to just follow the three steps:
If you want to truly succeed and potentially bank 2-3 triple digit winners like all of the ones I’ve shown you today, you MUST be able to follow this simple three step process.
If you’ve got an itchy trigger finger, this may not be right for you. But if you’re able to be patient and let the Pattern play itself out, you could make a profound amount of money from here on out.
PPK System Qualification #2: Are you able to act quickly once I issue a trade recommendation?
Because the Key Pivot Point is so important to you collecting as close to maximum gains on a trade as possible, it’s very important that you’re able to move quickly once I send you your monthly issue.
Each trade in there will be within a distinct window of opportunity for you to enter in very close to the first X appearing on a stock’s chart.
The longer you wait to execute the trade, the higher the price of the stock goes and the less potential profits you can collect.
So if you’re the kind of person who procrastinates or second guesses things to an extreme degree – The PPK System may not be successful for you.
But if you trust in the Pattern and move quickly you could see outsized gains repeatedly. Gains like…
820%… 578%… 562%… 526%… 513%… 439%… 408%… 406%… 386%… 295%… 288%… 216%… and more.
These are obviously very large returns we’re going for with these trades.
And waiting even just a few days could mean the difference between profits in the tens of thousands and profits in the hundreds.
So please, make sure you’re ready to go once your issue arrives!
And finally…
PPK System Qualifications #3: Are you able to dedicate the resources necessary to truly make life-changing profits? (Without being reckless with your money!)
Now I’ve told you, I don’t believe you should have to spend a fortune to make a fortune.
That’s why I’m using Joel Greenblatt’s “magic formula” for identifying cheap stocks that offer you the highest upside on your return.
At the same time, I want to be sure you make the most of these very special opportunities.
I want you to be able to see your wealth grow exponentially with each Pattern that arises and each recommendation I issue you.
Yes, you can invest as little or as much as you want in them…
A $100 investment won’t change your financial future however.
If that’s what you can afford then that’s what you should invest. I never want you to be reckless with your money.
But I’d recommend that given the potential profits The PPK System can deliver, that having at least $10,000 to invest is advisable.
Again, never invest more than you’re willing to lose. That’s a surefire way to go broke.
However I want you to get the most out of these recommendations.
Because as you’ve seen with the examples I’ve shown you, the potential returns could be enormous.
Also don’t forget that some of these Patterns lasted over the course of a couple years.
So it’s entirely reasonable to say that we could be carrying 8-10 open positions at any time.
Which is why I advise having at least $10k to spread out over all of those trades.
If you’re willing and able to devote those resources to The PPK System, I believe you’ll be in a prime position to take advantage of a very good number of these potential triple digit opportunities as I issue them.
So if you believe you meet these three qualifications:
- To maintain discipline with your PPK trades.
- To act in timely fashion to execute them.
- And to devote the resources necessary to be successful with them.
…you’re ready to become a charter member of The PPK System today.
And you could be watching your first Pattern opportunity go higher and higher as early as a few days from now!
Which leads me to one final question. Only this is a question YOU’RE probably asking…
How much will becoming a member of The PPK System cost?
I’ll be honest, I’m not the only investment analyst who’s created a system to profit off of the Pattern and the momentum opportunities it creates.
But I’ve personally seen (and you may have to) those other research services that use this strategy charge $4,000 a year to join.
That’s an incredible amount of money to commit… and it’s money you could instead be using to grow your wealth on these Pattern trades.
Trades like Esperion Therapeutics that delivered 406% on its Pattern…

That trade would have turned $4,000 into $20,240!
Or Lannett Company, which could have netted you 562%…
If you’d have put $4,000 into that trade you’d have walked away with $26,480!
Even one of the Pattern’s “smaller” wins… like the 170% Ziopharm Oncology delivered…
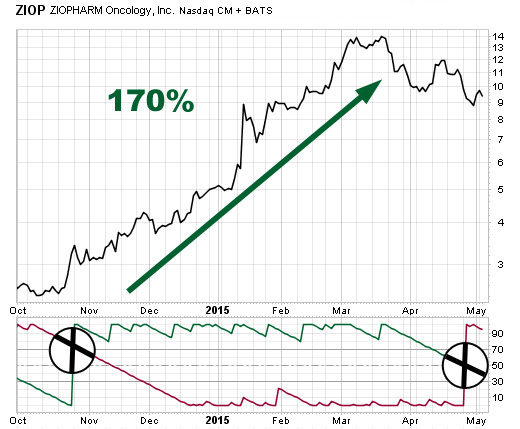
… would have turned that $4,000 into $10,800!
So as you can see – there’s much better ways to use $4k.
And as I’ve shown you today, good AND cheap are two things I love to combine.
I know The PPK System is good. I’ve privately researched and tested it extensively. And I’m confident that this strategy along with my expertise in pattern recognition will deliver 2-3 triple digit opportunities every month.
But I also know that The PPK System is cheap too.
Not cheap in a bad way, mind you. You’ll receive top level quality research, recommendations and access to all the tools you’ll need (including THREE bonus reports) as a charter member.
But instead of paying $4,000 a year, I’m only going to ask that you pay $199 for your first year.
The value here is incredible. But I’ve intentionally made The PPK System affordable so that I can deliver these opportunities to a wide audience.
Now remember – many of these trades do take a while to run through the entire Pattern. Sometimes over a year.
And you’ll want to be informed and aware of when the second X appears and it’s time to sell for what we aim to be, maximum profits.
That’s why I’m also offering a 2-YEAR membership to The PPK System, which will only cost you $299 for your first term.
This will go a long way towards ensuring you never miss a SELL alert on any long-term trades I issue during your first year with me.
And it’s only $299, for a full 2 years of Pattern opportunities.
That could mean as many as 72 opportunities to bank triple digit gains over your subscription!
After your first term of either one year or two expires, we’ll automatically renew you at the regular rate of just $199 a year… which, if you follow my alerts correctly, will be practically chump change compared to the profits you’re collecting regularly.
And you can tell us to stop renewing you at any point and I’ll have my team refund whatever is owed to you, no questions asked.
However, I want you to feel 100% secure in joining The PPK System today.
That’s why I’m including this very special TWO-PART satisfaction guarantee for charter members only.
PPK System Guarantee #1: You’ll know within 30 days that this system is the real deal.
If by the end of your first month and your first set of Pattern recommendations, you don’t see that you’re able to begin profiting immediately from them, simply contact my team and we’ll refund 100% of your subscription cost right away.
You can take the first month of your membership to read over the bonus reports, learn more about the Pattern and how it works… maybe you’ll even paper trade the first set of recommendations I send you – just to see how they play out.
But if something, ANYTHING, doesn’t feel right to you, just contact us in that 30-day window and we’ll send you back every penny of your charter member fee.
So really there’s zero risk to accepting this offer today!
Then there’s the second part of my guarantee…
PPK System Guarantee #2: You’ll have the opportunity to cash in on at least SIX triple digit winners in your first year!
This part really puts the risk on my shoulders.
Because if I don’t deliver to you, SIX Pattern trades that achieve triple digit profits during your first year, I’m going to owe you.
Now I’m not exactly nervous. Remember, once that first X appears, we BUY
Once the second X appears, we sell.
And during that time while these stocks are propelled by incredible momentum (think about that baseball flying through the air, unstoppable) they can rack up some truly massive gains.
Like the 578% that Arrowhead produced during its Pattern…
Or the 439% Eagle Pharmaceuticals shot up…
The 386% Medivation skyrocketed…
Or the 408% Addus Homecare returned between its first and second X.
Having spent months researching and observing the Pattern on dozens of stocks, I know that six triple digit gains in the first year is entirely achievable, probably even likely.
But if I don’t deliver those opportunities to you, I’ll pay for a SECOND year of The PPK System for you.
And if you’ve signed up for the two-year membership, I’ll simply credit half of that amount back to your credit card.
Your second year will be on the house either way.
This way you’ll know I’m holding myself and my PPK System accountable for its performance.
As I said, I’ve spent hundreds of man-hours and resources launching this service.
And I know it’ll be a success for my readers.
So now it’s your turn to discover that too.
Your charter membership offer, which features THREE bonus reports plus this unique two-part guarantee is only available for a very short time.
And your first Pattern opportunities could be delivered to your e-mail within days of your membership becoming official.
By this time next month you could already have three winning positions in your portfolio thanks to the Pattern.
But now it’s up to you to make your move.
Other investors have paid as much as $4,000 for just ONE year of this same research and recommendations.
You’ll pay only the slightest fraction of that… with the opportunity to make thousands of dollars on a monthly basis a very real possibility.
I’ve put my money, my performance and my confidence in the Pattern on the line here today.
I hope you’ll become a charter member of The PPK System so that I can prove to you why I have.
Start using the Pattern to grow your wealth in a way you may have never thought possible…
All you have to do is select a membership plan below, sign up, and you’ll immediately receive the first play in a huge line of potential triple-digit gains.
Again, my name is Rick Pendergraft and I look forward to a long and profitable relationship with you!
Best Regards,
Rick Pendergraft